Environment Manager
This page refers to an older version of the product.
View the current version of the User Help.
Environment Manager Monitor
User Interface
Environment Manager Monitor (EmMon) provides a user interface to view and analyze log files from the Environment Manager Agent. The tool replaces Environment Manager LogViewer.
The landing page displays when the Environment Manager Monitor loads. The landing page provides access to load log files, view raw logs and analyze logs. Links are available to access commonly used filters.
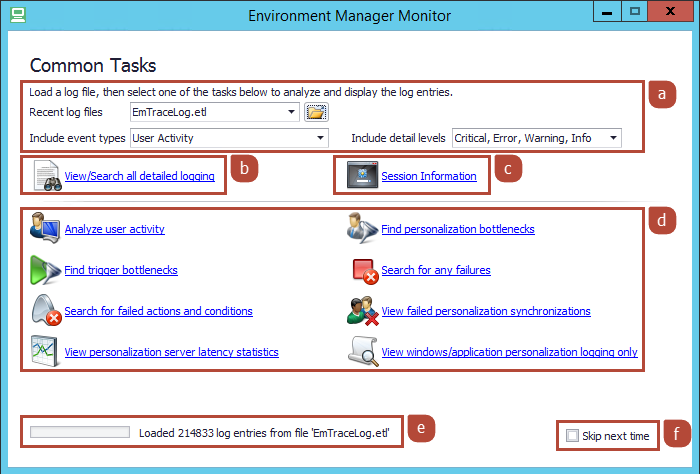
| Label | Description |
| a | Load Log Files
Load a log file from disk. Recently used log files are populated in the drop-down menu. Select the event types and logging level to load into Environment Manager Monitor. For further details, see Loading Log Files. |
| b | View Raw Logs from Live or Disk
View raw log lines from the live log or from a log file on disk. You can sort, filter, group, search, and format the dataset. For further details, see Viewing Raw Logs from Live or Disk. |
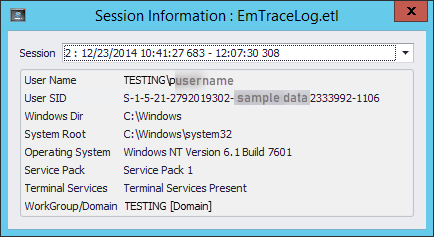
| c | View Session Information
View detailed information about each user’s session from the loaded log file. For further details, see Viewing Session Information. |
| d | Analyze Log Files from Disk
View an analysis of a log file, either in a grid or chart. Log entries relating to the same event are collected together. The Analyze user activity option displays the analyzed view with no filters applied. The dataset can be sorted, filtered, grouped, and searched. Built-in filters are available on the landing page to provide access to the following commonly used tasks:
For further details, see Analyzing Log Files from Disk. |
| e | Viewing Loading Progress
When loading a log file, the loading progress displays. The log file may take a few minutes to load depending on its size, event types and event detail. After a log file is loaded, the number of log entries in the file displays. |
| f | Selecting Loading Behavior
The Skip next time option can be set as follows:
|